3 - Track your pipeline run
Track your pipeline run
You successfully compiled your first pipeline and already started it. Awesome!
Now it’s time to track the status of your pipeline run. You should already see the detailed overview. If this is not the case, you can go to the detailed overview by clicking on the name of your pipeline in the overview view.
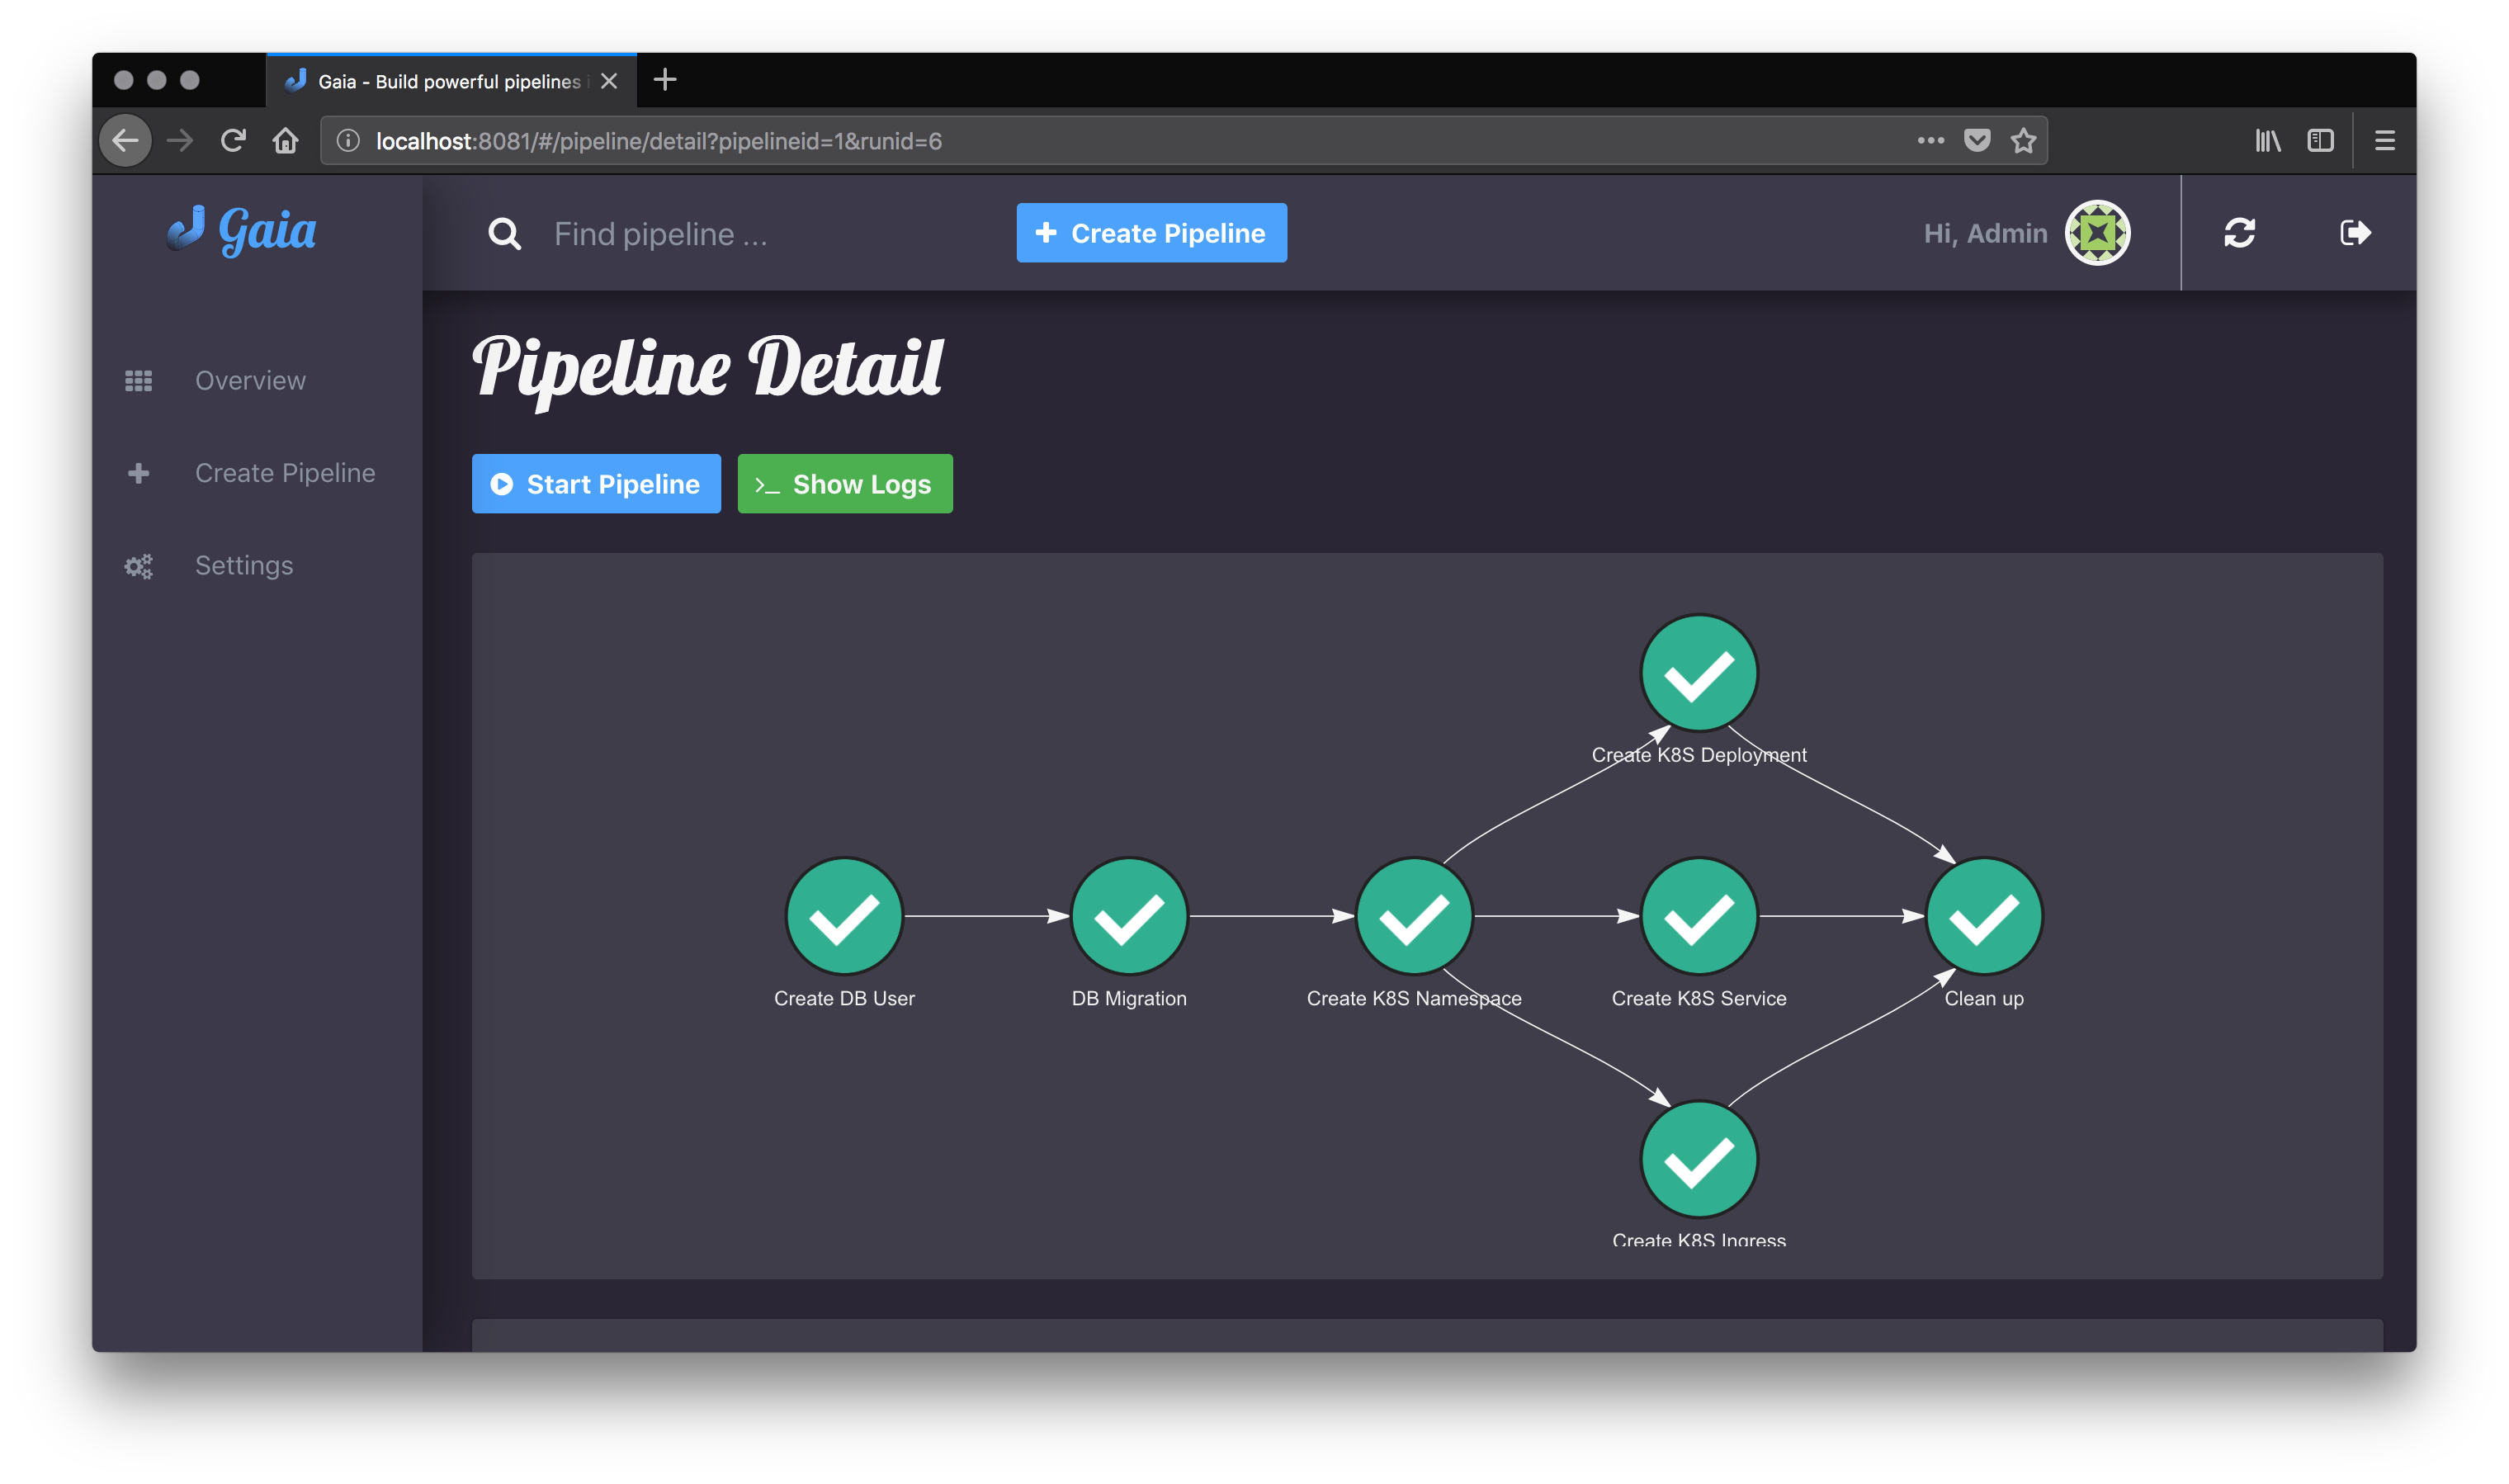
At the top you can start another run of your pipeline by clicking on the button “Start Pipeline”. Next to this button you should see another button “Show Logs”. If you click on this button you will be redirected to the log view of your pipeline run.
The next part is the graphical view of your pipeline. It’s a graph that has been automatically generated from your developed pipeline and will be automatically updated when one job of your pipeline has been completed.
Point your mouse pointer over it and scroll in and out. Use it to zoom in/out of your graph. This is really helpful when you have a complex/huge graph.
At the bottom of the detailed pipeline view you should see a history table of all your runs. You can click on the ID to select this run which will be shown in the detailed view.